There is no dedicated SPSS appendix for this chapter — its content is conceptual rather than procedural. The key protection against the problematic practices described here is developing good research habits before you collect data: pre-register your hypotheses, document your analysis decisions in a syntax or script file, and report all outcomes regardless of significance.
23.1 The Credibility Problem in Science
In 2011, a paper in Psychological Science demonstrated something uncomfortable: by making small, individually defensible decisions about data collection, outlier exclusion, covariate selection, and stopping rules, researchers could make almost any dataset yield a significant result[1]. A subsequent large-scale investigation found that the majority of published studies in psychology failed to replicate when re-run by independent teams (Open Science Collaboration, 2015). Movement science has not been immune: reviews of the exercise science and sports medicine literature have documented low statistical power, selective reporting, and inflated effect sizes across a range of research domains[2,3].
These problems do not arise because most researchers intend to deceive. They arise from the way incentives, analytic flexibility, and publication norms interact. Understanding them is the first step toward doing research that is credible, reproducible, and genuinely useful.
23.2 p-Hacking and Researcher Degrees of Freedom
p-hacking (also called data dredging, fishing, or significance chasing) refers to the practice of running, modifying, and re-running analyses until a p-value below .05 is obtained[4]. It exploits a basic property of significance testing: if you test enough hypotheses, add or remove covariates, try different subsets of the data, or collect a few more participants and re-test, you will eventually obtain p < .05 by chance even when the null hypothesis is true.
[1] coined the term researcher degrees of freedom to describe the many seemingly minor decisions that collectively create this problem:
When to stop collecting data (after 20 participants? 30? After peeking at the results?)
Which outliers to exclude and by what rule
Which covariates to include in the model
Whether to use parametric or nonparametric tests
Which outcome variable to emphasize when several were collected
Whether to collapse or split factor levels
None of these decisions is wrong in isolation. The problem arises when they are made after seeing the data, guided by whether they produce a significant result. Each such decision inflates the actual Type I error rate far above the nominal .05 level.
23.2.1 What p-hacking looks like in practice
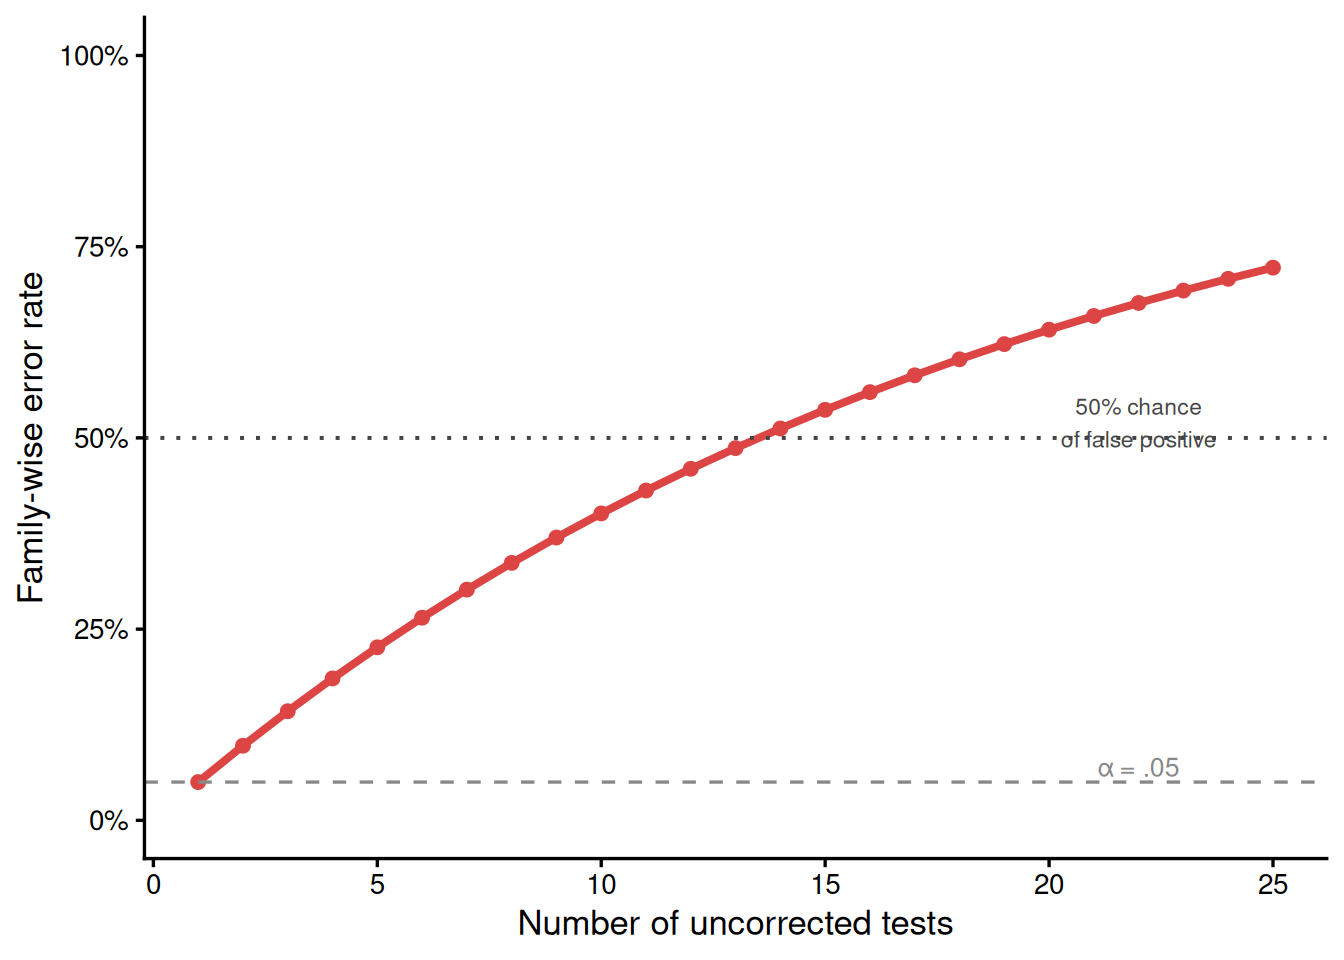
Imagine a researcher running a 12-week resistance training study. They collect data on strength, functional performance, pain, body composition, and quality of life. If they run an omnibus ANOVA on all five outcomes and then report only the significant ones without adjustment, the probability of at least one false positive among five independent tests at α = .05 is \(1 - (1 - .05)^5 = .226\) — more than four times the stated error rate. If they also try two or three different ways of analyzing each outcome, that number climbs further.
The figure below illustrates how the family-wise Type I error rate increases with the number of uncorrected tests.
Figure 23.1: Family-wise Type I error rate as a function of the number of uncorrected significance tests conducted at α = .05. Even a modest number of tests produces a substantial probability of at least one false positive.
23.2.2 Protecting against p-hacking
The fundamental protection is pre-registration: specifying your hypotheses, outcome variables, sample size, and analysis plan before collecting data (see Section 23.6). Within an existing dataset, you can protect against inflation by:
Applying Bonferroni or Benjamini-Hochberg corrections when testing multiple outcomes (see Chapter 14);
Distinguishing confirmatory analyses (pre-specified hypotheses) from exploratory analyses (anything discovered after looking at the data) and labeling them as such in the manuscript;
Reporting all analyses you ran, not only those that were significant.
23.3 HARKing: Hypothesizing After Results Are Known
HARKing (Hypothesizing After Results are Known) describes the practice of presenting a post-hoc finding as if it had been a pre-specified hypothesis[5]. A researcher who runs an exploratory analysis, discovers a surprising group difference, and then writes their introduction as if that difference was the primary prediction has HARKed — even if every individual statistical test was performed correctly.
HARKing is problematic because it transforms exploratory results into confirmatory claims without the inferential cost. True confirmatory tests are rare: each prediction, specified in advance, “uses up” some of the Type I error budget. Exploratory findings presented as confirmations create a scientific record filled with seemingly-strong confirmatory evidence that is actually much weaker.
23.3.1 Confirmatory versus exploratory research
The distinction between confirmatory and exploratory research is not a judgment about quality. Exploratory work is valuable — it generates hypotheses and reveals unexpected patterns. The problem arises when exploratory findings are dressed up as confirmatory results. The solution is transparency:
Label analyses as exploratory in the methods section.
Use language like “we observed, post hoc, that…” rather than “we hypothesized that…”
Report that additional analyses were run without being selected for their significance.
23.4 Publication Bias and the File Drawer Problem
Publication bias describes the tendency for journals to publish statistically significant results and to reject or return null results, regardless of study quality. Studies with p < .05 are substantially more likely to be submitted, accepted, and cited than studies with p > .05. The consequence is a scientific literature where the published record systematically overestimates effect sizes and underestimates the prevalence of null findings[3].
The file drawer problem is the companion phenomenon: null results accumulate in researchers’ file drawers (or hard drives) rather than being submitted for publication. Over time, this means that multiple independent teams may have found no effect of an intervention, but because none submitted or published those results, the field does not know.
Publication bias is not easily solved by individual researchers — it is partly a structural feature of academic incentives. However, you can mitigate it by:
Pre-registering studies (which makes it possible to identify registered studies that were never published);
Submitting null results as registered reports or to journals with explicit null-results policies;
Including any non-significant findings in your manuscripts even when the primary result is significant;
Conducting and reporting power analyses so that a null result can be interpreted as “probably not a meaningful effect” rather than “probably underpowered.”
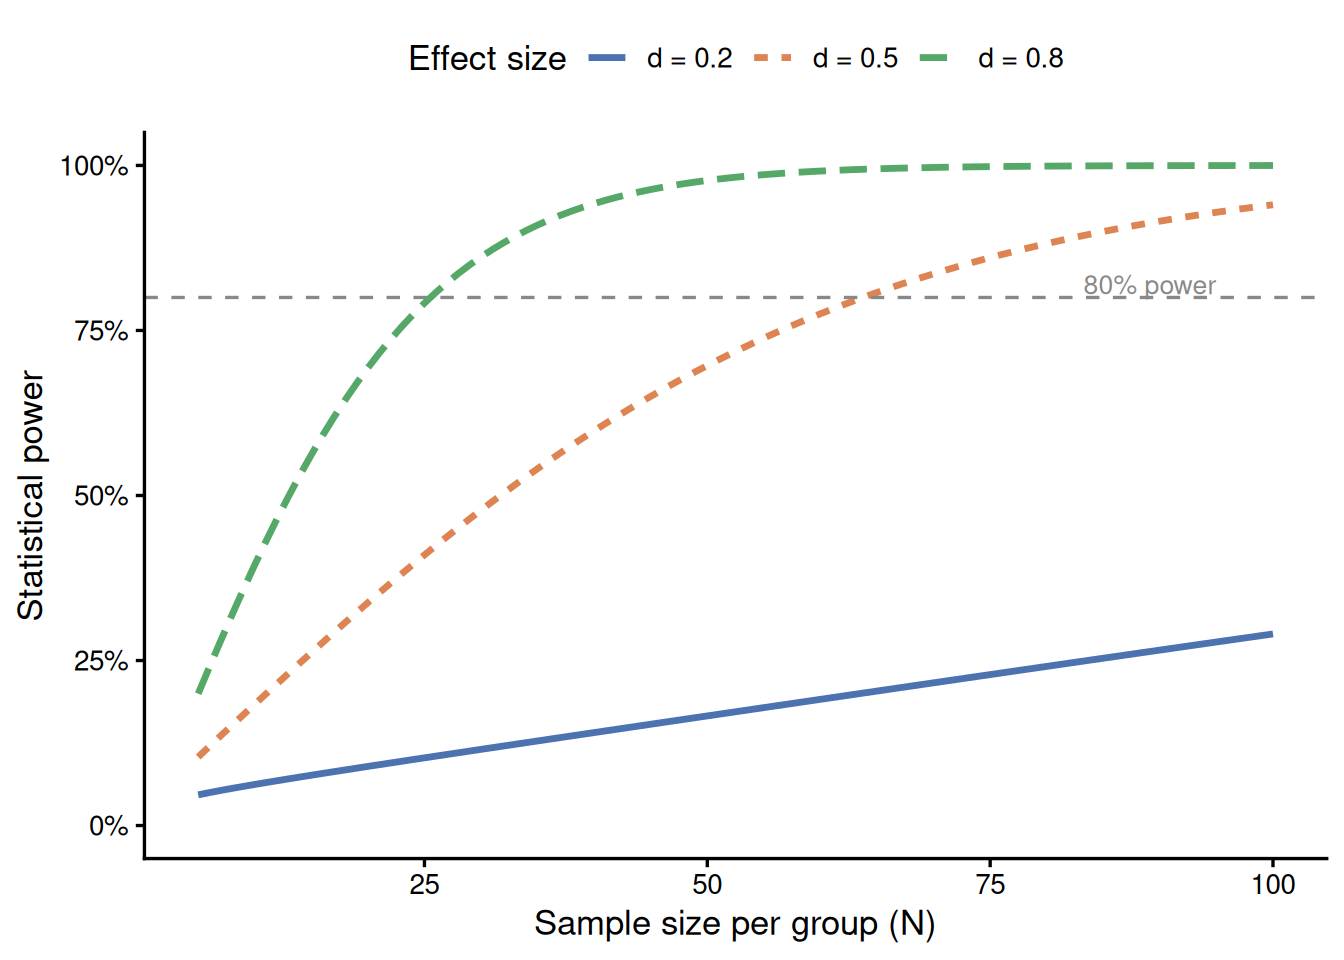
23.5 Statistical Power and Sample Size
Statistical power is the probability of correctly rejecting the null hypothesis when a true effect of a given size exists (formally, \(1 - \beta\), where β is the Type II error rate). Chapter 10 introduced this concept; here we focus on its ethical dimensions.
Studies that are severely underpowered are problematic for two reasons. First, they are unlikely to detect real effects — wasting participants’ time and researchers’ resources. Second, when an underpowered study does find a significant result, that result is more likely to be a false positive or to overestimate the true effect size — what[2] called the winner’s curse.
A common heuristic is to target 80% power (β = .20) for a medium effect size using Cohen’s benchmarks. A more principled approach is to base the expected effect size on high-quality prior studies, and to acknowledge the uncertainty in that estimate. Power analyses should be reported in the methods section along with the assumed effect size and its source.
Figure 23.2: Relationship between sample size and statistical power for an independent samples t-test at α = .05, for small (d = 0.2), medium (d = 0.5), and large (d = 0.8) effect sizes. The horizontal dashed line marks the conventional 80% power threshold.
23.6 Open Science Practices
Open science is a set of practices designed to make research more transparent, reproducible, and credible[5]. The four most important for movement science students are pre-registration, open data, open materials, and registered reports.
23.6.1 Pre-registration
Pre-registration means publicly documenting your research hypotheses, design, sample size, and analysis plan before data collection begins. The document is time-stamped and stored on a platform such as the Open Science Framework (https://osf.io) or AsPredicted (https://aspredicted.org). Because the pre-registration is permanent and public, readers can distinguish what was planned from what was added after the data were seen.
Pre-registration does not prevent exploratory analyses — it simply requires you to label them honestly. A pre-registered study with clearly labeled exploratory analyses is more credible than a non-pre-registered study where the distinction is invisible.
23.6.2 Open data and open materials
Open data means sharing the dataset underlying a publication in a public repository (OSF, Zenodo, Figshare, institutional repositories). Open materials means sharing the analysis scripts, questionnaires, and protocols used to collect and analyze data. Together, these allow other researchers to verify computations, detect errors, and build directly on your work.
Sharing data requires attention to participant confidentiality. Direct identifiers (names, birth dates, exact addresses) must be removed. Indirect identifiers (rare demographic combinations) may need further protection. Most IRBs and data protection frameworks permit sharing de-identified data; your consent form should state this possibility.
23.6.3 Registered reports
Registered reports are a publication format in which a journal reviews and commits to publish a study before data collection, based solely on the quality of the design and hypotheses. Regardless of whether the results are significant, the journal publishes the paper. This format structurally removes publication bias for studies that follow the pre-registered protocol.
As of 2026, over 300 journals offer registered reports across psychology, medicine, sports science, and related fields. Several exercise science journals have adopted or are piloting this format.
23.7 Replication and Cumulative Evidence
A single significant result, however well-conducted, is not conclusive evidence. The history of science is full of striking single findings that did not replicate. Credible conclusions in movement science come from converging evidence across independent replication studies, systematic reviews, and meta-analyses.
Replication comes in several forms: direct replication repeats the original procedure as closely as possible; conceptual replication tests the same theoretical prediction with a different method. Both contribute to cumulative evidence. When an effect replicates consistently across diverse samples and methods, confidence in its reality increases substantially.
When reading the literature, treat individual studies as evidence to be weighed rather than conclusions to be accepted. Ask:
What is the sample size and power?
Was the study pre-registered?
Have independent teams replicated this?
Is the effect size plausible given the field?
Does the confidence interval suggest precision or large uncertainty?
23.8 Moving Beyond “p < .05”
The American Statistical Association has twice called for researchers to move beyond a binary “significant vs. non-significant” framing of results[6,7]. The argument is straightforward: p < .05 is an arbitrary threshold that bears little relationship to practical importance, replication probability, or evidential weight. A p-value of .049 and one of .051 represent essentially the same evidence about the world, yet tradition treats them as categorically different.
[8] proposed retiring the concept of statistical significance entirely and instead reporting and discussing effect sizes and confidence intervals without dichotomizing results. While debate continues about how to reform practice, three principles reflect the emerging consensus:
Report exact p-values. Let readers assess the evidence directly rather than comparing to a threshold.
Interpret effect sizes, not just p-values. A significant result with d = 0.08 is not the same evidence as one with d = 1.20, even if both have p = .04.
Report confidence intervals. An interval that narrowly excludes zero (d = 0.12, 95% CI [0.01, 0.23]) communicates something very different from one that clearly excludes zero (d = 1.20, 95% CI [0.95, 1.45]).
These practices do not require abandoning null hypothesis significance testing — they require using it honestly and in combination with other evidence.
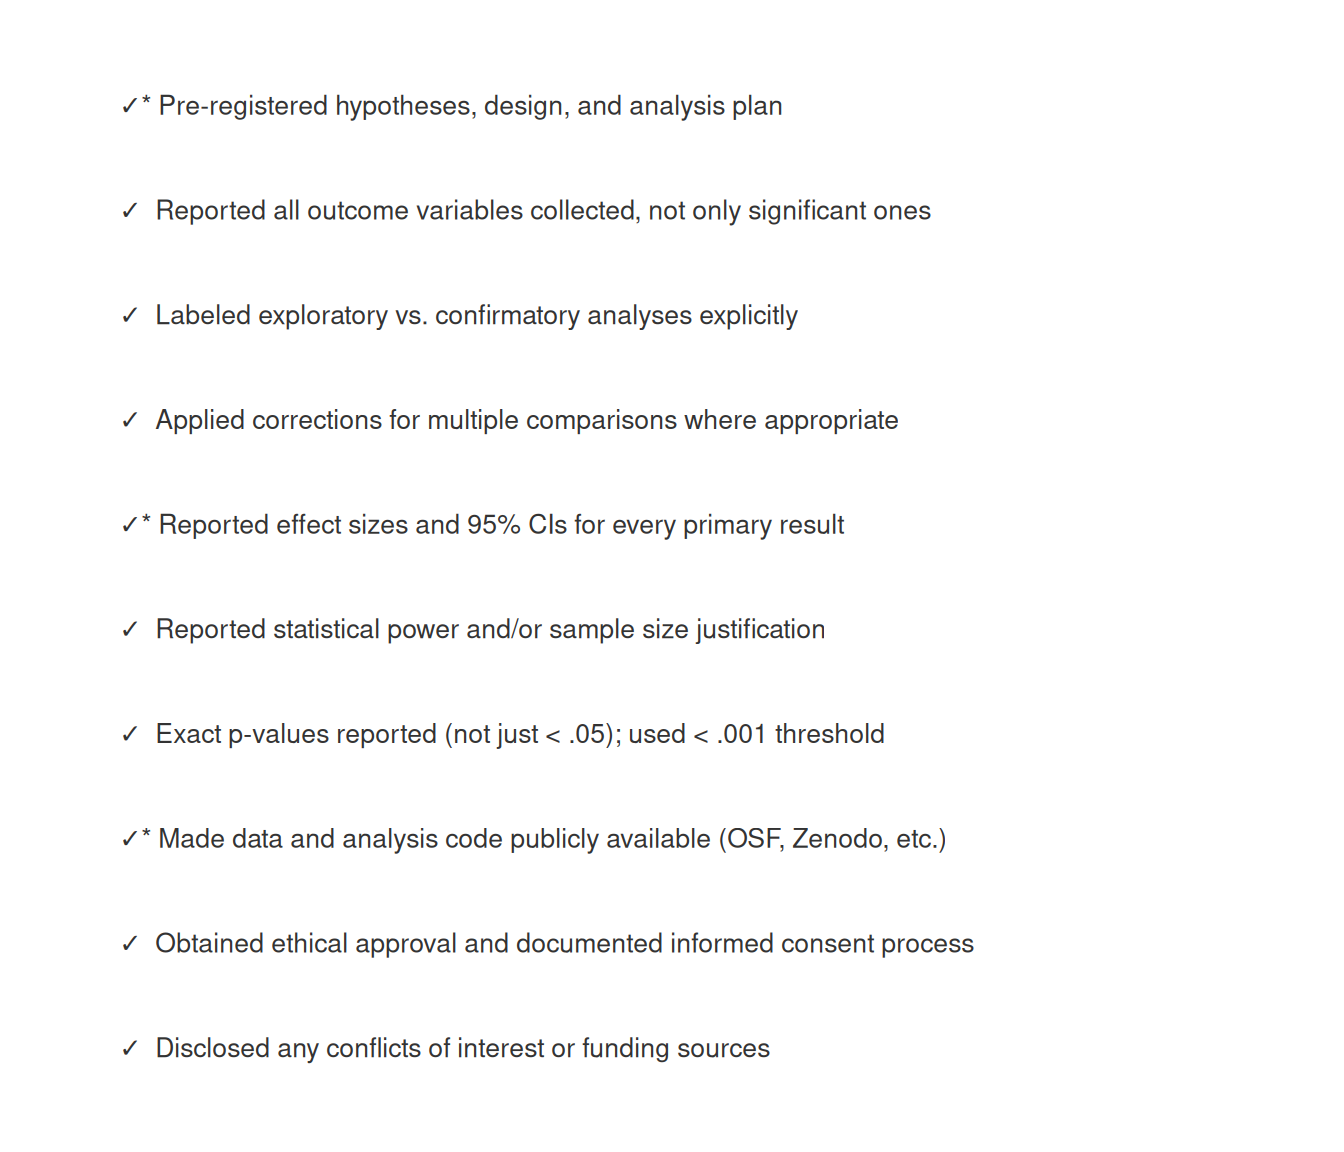
23.9 A Practical Ethics Checklist
Before submitting your work, review the following:
Figure 23.3: A practical ethics and open science checklist for movement science researchers. Items marked with * are especially impactful for study credibility.
23.10 Practice: quick checks
This is selective reporting, a form of p-hacking. Testing five outcomes at α = .05 without correction inflates the family-wise error rate to about 23%. Reporting only the significant outcome misrepresents the evidence and inflates the apparent credibility of the finding.
p = .04 and p = .06 represent nearly identical evidence. The .05 threshold is a convention, not a bright line between “effect” and “no effect.” A p-value of .06 with a meaningful effect size and a confidence interval that just spans zero may be stronger practical evidence than a p = .04 with a negligible effect size. Both results should be reported with effect sizes and CIs and interpreted together.
HARKing (Hypothesizing After Results are Known) is presenting exploratory, post-hoc findings as if they were pre-specified hypotheses. Pre-registration prevents it by creating a public, time-stamped record of hypotheses before data collection. Readers (and reviewers) can compare the pre-registration to the manuscript and identify any changes made after the data were seen.
Not necessarily. A single failed replication, like a single significant result, is one data point. Possible explanations include: the original was a false positive; the replication had insufficient power; there are genuine moderating variables (population, protocol differences) that explain the discrepancy. Cumulative evidence from multiple independent replications is needed before a conclusion about the original finding’s validity can be drawn.
Options include: expand recruitment (additional sites, extended timeline), reduce scope (a within-subjects design may require fewer participants), treat the study as a pilot and report it explicitly as such (noting the low power and the risk that the study is underpowered), or lower the target effect size if there is good reason to believe the effect is larger than d = 0.5. Do not proceed with N = 20 and present the result as definitive — a study with ~25% power to detect a medium effect has a high false-negative rate and any significant result it produces is likely to overestimate the true effect size.
First, remove all direct identifiers (names, dates of birth, precise locations). Second, assess whether any combination of remaining variables could indirectly identify participants (rare demographic combinations, unusual scores). Third, upload the de-identified dataset and analysis script to an open repository (OSF, Zenodo) and provide the repository link in the manuscript. Fourth, verify that your original consent form permitted data sharing; if not, consult your IRB about the path forward.
NoteRead further
[1] is the essential reading on researcher degrees of freedom and p-hacking.[3] provides the broader argument about why most published findings are unreliable.[5] presents a comprehensive manifesto for reproducible science with practical recommendations at every level of the research process.[6] and[7] are the ASA’s own statements on moving beyond p < .05. For an accessible treatment of open science practices, the Open Science Framework (https://osf.io) maintains tutorials and templates for pre-registration and data sharing.
NoteEnd of Part VII — and of the textbook
This chapter closes Statistics for Movement Science. The three chapters of Part VII — on software, reporting, and research ethics — are designed to be read together: choose your tools thoughtfully, report your results completely, and design your studies in ways that produce credible, reproducible evidence. Every technique you learned in Parts I through VI is only as valuable as the integrity with which it is applied.
1. Simmons, J. P., Nelson, L. D., & Simonsohn, U. (2011). False-positive psychology: Undisclosed flexibility in data collection and analysis allows presenting anything as significant. Psychological Science, 22(11), 1359–1366. https://doi.org/10.1177/0956797611417632
2. Button, K. S., Ioannidis, J. P. A., Mokrysz, C., Nosek, B. A., Flint, J., Robinson, E. S. J., & Munafò, M. R. (2013). Power failure: Why small sample size undermines the reliability of neuroscience. Nature Reviews Neuroscience, 14, 365–376. https://doi.org/10.1038/nrn3475
4. Head, M. L., Holman, L., Lanfear, R., Kahn, A. T., & Jennions, M. D. (2015). The extent and consequences of p-hacking in science. PLoS Biology, 13(3), e1002106. https://doi.org/10.1371/journal.pbio.1002106
5. Munafò, M. R., Nosek, B. A., Bishop, D. V. M., Button, K. S., Chambers, C. D., Percie du Sert, N., Simonsohn, U., Wagenmakers, E.-J., Ware, J. J., & Ioannidis, J. P. A. (2017). A manifesto for reproducible science. Nature Human Behaviour, 1, 0021. https://doi.org/10.1038/s41562-016-0021
6. Wasserstein, R. L., & Lazar, N. A. (2016). The ASA statement on p-values: Context, process, and purpose. The American Statistician, 70(2), 129–133. https://doi.org/10.1080/00031305.2016.1154108
7. Wasserstein, R. L., Schirm, A. L., & Lazar, N. A. (2019). Moving to a world beyond "p < 0.05". The American Statistician, 73(sup1), 1–19. https://doi.org/10.1080/00031305.2019.1583913
8. Amrhein, V., Greenland, S., & McShane, B. (2019). Scientists rise up against statistical significance. Nature, 567, 305–307. https://doi.org/10.1038/d41586-019-00857-9