The APA Style Results Reporting appendix provides fill-in-the-blank templates for every test covered in this textbook, drawn from the APA Publication Manual[1]. The APA Tables appendix provides formatted table templates. Use the present chapter to understand why each element is reported; use the appendix for exact wording when writing up your own results.
Why Reporting Standards Exist
Statistical results are only useful if other researchers can interpret, evaluate, and build on them. A test statistic by itself — “\(t = 3.42\)” — is meaningless without knowing the degrees of freedom, the direction of the effect, the sample size, and some measure of how large the effect actually is. Reporting standards exist to ensure that every published result contains enough information for a reader to:
- understand what was found;
- assess whether the conclusion is warranted;
- attempt a replication.
The guidelines set by the American Psychological Association[1], the Statistical Methods in Psychology Journals task force report[2], and more recent recommendations from the American Statistical Association[3,4] converge on a common set of requirements. Movement science journals — Medicine & Science in Sports & Exercise, the Journal of Strength and Conditioning Research, Physical Therapy, and others — have largely adopted these standards.
What Must Be Reported
Every inferential result should include at minimum six pieces of information: the test statistic, its degrees of freedom (or equivalent), the p-value, a measure of effect size, a confidence interval, and a direction (which group was higher, or which way the effect went). Omitting any of these makes the result impossible to interpret fully.
The test statistic
Report the test statistic with its symbol italicized: t, F, χ², U, W, H. Include enough decimal places for precision — two is conventional — and always include the sign for directional statistics like t and z.
Degrees of freedom
Degrees of freedom (df) appear immediately after the statistic in parentheses: \(t(58) = 3.42\). For F-ratios, report both: \(F(2, 87) = 5.61\). For nonparametric statistics that use sample size rather than df, report N and group sizes instead.
The p-value
Report the exact p-value to two or three decimal places: \(p = .023\), not \(p < .05\). When p is very small, write \(p < .001\). Do not write \(p = .000\). Note that APA style omits the leading zero before the decimal for statistics that cannot exceed 1.0 (including p-values, correlations, and proportions): write \(p = .023\), not \(p = 0.023\).
The p-value tells you the probability of observing a result at least this extreme if the null hypothesis were true. It does not tell you the probability that the null hypothesis is true, the probability that your finding will replicate, or the size of the effect[3,5]. Do not interpret p as any of these things.
Effect size
Report a standardized effect size — Cohen’s d, η², partial η², ω², Hedges’ g, r, R², or the appropriate equivalent — alongside the test statistic. Effect size answers the question that p cannot: “how large is this effect in practical terms?”[6] provides the widely-used benchmarks (small, medium, large), but always contextualize them against your specific field and measurement scale.
Confidence interval
Report a 95% confidence interval (CI) for the primary effect of interest. Present CIs in square brackets following the point estimate: \(M_{\text{diff}} = 4.2\) kg, 95% CI [1.8, 6.6]. The interval conveys the precision of your estimate — a wide CI signals low precision; a narrow CI signals high. CIs for effect sizes (not just means) are strongly recommended[7].
Direction
Report which group was higher or which condition produced a larger value. “\(t(58) = 3.42, p = .001\)” tells the reader that the groups differed, but not which group was stronger, faster, or in more pain. Always state the direction plainly in your prose.
APA Style for Statistics
APA style[1] specifies conventions for formatting statistical symbols and values. The most important rules are summarized below.
Italicize all statistical symbols used as variables: M, SD, SE, t, F, p, r, d, n, N, df, η².
Do not italicize abbreviations for descriptive labels that are not symbols: “ANOVA,” “ICC,” “MCID,” “NNT.”
Decimal places: Use two decimal places for most statistics (t, F, d, r). Use three for p-values and probabilities unless rounding to .000, in which case write p < .001.
No leading zero for values bounded by ±1.0: write p = .047, not p = 0.047; write r = .62, not r = 0.62.
Spaces around operators: \(t(58) = 3.42\), not \(t(58)=3.42\).
Parentheses for df: \(F(2, 87) = 5.61\), not \(F_{2,87} = 5.61\) in running text.
Writing a Results Section
A results section has a clear structure: first describe the participants and any data exclusions, then present descriptive statistics, then present inferential results in the order they address your research questions or hypotheses. Avoid switching back and forth between description and inference.
A worked example
Suppose you ran a one-way ANCOVA comparing three training groups on post-test VO₂max, with pre-test VO₂max as the covariate. A well-reported result reads:
After adjusting for pre-test VO₂max, there was a significant effect of training group on post-test VO₂max, \(F(2, 56) = 7.43\), \(p = .001\), partial \(\eta^2 = .210\), 95% CI [.03, .37]. Post hoc comparisons (Tukey’s HSD) indicated that the high-intensity group (\(M\) = 48.2 mL/kg/min, \(SD\) = 4.1) outperformed both the moderate-intensity group (\(M\) = 44.7, \(SD\) = 3.8; \(p\) = .012, \(d\) = 0.89) and the control group (\(M\) = 42.1, \(SD\) = 4.3; \(p\) < .001, \(d\) = 1.44). The moderate-intensity and control groups did not differ significantly (\(p\) = .091, \(d\) = 0.63).
This single paragraph provides: test statistic, degrees of freedom, p-value, effect size, confidence interval, direction, group means and SDs, and post hoc comparisons with their own p-values and effect sizes.
Common errors
Reporting only the p-value. Writing “the groups differed significantly (p = .003)” omits the test statistic, effect size, and confidence interval. Reviewers increasingly reject papers that report only p.
Interpreting non-significance as equivalence. A non-significant result (p > .05) does not mean the groups were the same — it means the data were insufficient to detect the effect at the chosen threshold[8]. Report the effect size and CI regardless of significance.
Misidentifying the p-value. Common errors include “there was a 3% probability the null was true” and “the result has a 97% chance of replicating.” Neither is correct. The p-value is the probability of obtaining a result at least this extreme given that the null is true[5].
Reporting only adjusted means from ANCOVA without the covariate. Always report the covariate, its F-statistic, and whether it was significant. Report both unadjusted and adjusted means when space permits.
Rounding p to .000. SPSS sometimes prints “p = .000.” Report this as \(p < .001\).
Reporting Clinical Measures
Chapter 20 introduced MCID, NNT, sensitivity, specificity, and AUC. These measures have their own reporting conventions.
MCID: State the value, its source (distribution-based or anchor-based), and the reference. Example: “A distribution-based MCID of 6.1 points (0.5 × SD_pre = 12.2) was applied to classify responders.”
NNT: Report the ARR, NNT, and 95% CI. If the CI includes zero or ∞, report this transparently. Example: “ARR = 14.7%, NNT = 6.8, 95% CI [3.0, ∞], indicating modest and uncertain clinical advantage at this sample size.”
Sensitivity/specificity: Report sensitivity, specificity, PPV, NPV, and both likelihood ratios with the cut-point and sample used. A 2×2 table aids clarity.
AUC: Report AUC, SE, 95% CI, and p-value. Example: “AUC = .683, SE = .065, 95% CI [.55, .81], p = .008, indicating moderate discriminative ability.”
Reporting Nonparametric Tests
Nonparametric tests have their own conventions. Key points:
- Mann-Whitney U: Report U, n for both groups, p, and r as effect size (\(r = Z / \sqrt{N}\), where N is total sample size).
- Wilcoxon signed-rank: Report W (or T), N (excluding ties), p, and r.
- Kruskal-Wallis: Report H, df, N, and p. Follow up with Dunn’s test for pairwise comparisons.
- Friedman’s: Report \(\chi^2_r\), df, N, and p. Report Kendall’s W as effect size.
- Spearman ρ: Report ρ, N, and p, and note that this is a rank correlation.
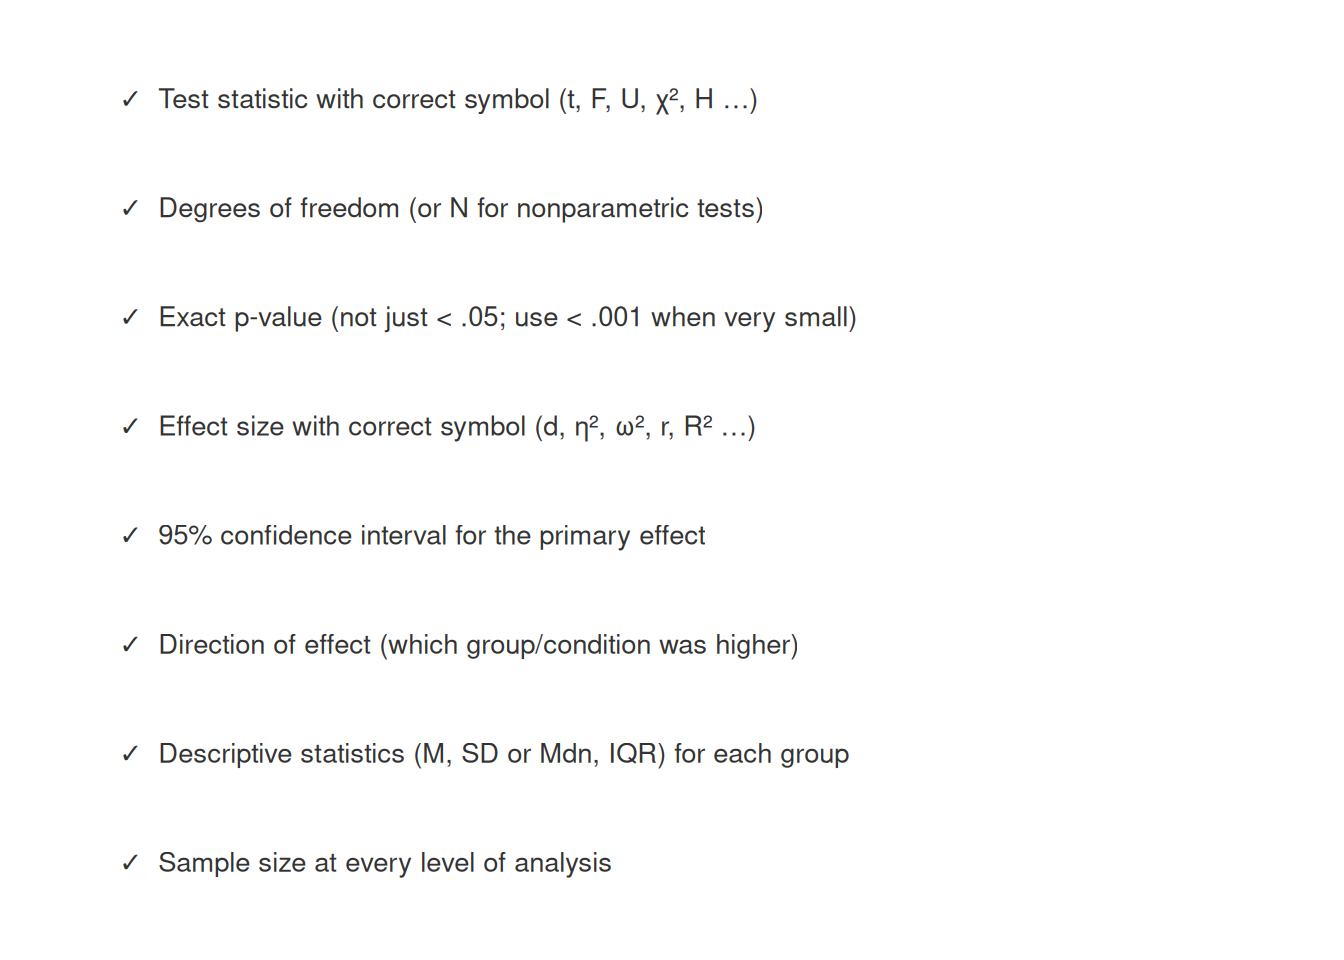
A Reporting Checklist
Before submitting a manuscript or thesis chapter, verify that every inferential result includes all of the following:
Practice: quick checks
The test statistic and its type (e.g., t, F, U), degrees of freedom, effect size, confidence interval, direction (by how much did the training group improve?), and descriptive statistics (M, SD) for each group.
Because p-values cannot exceed 1.0, the leading zero conveys no information. APA style consistently omits the leading zero for all statistics bounded by ±1.0, including r, proportions, and probabilities.
No. A non-significant result means the data were insufficient to reject the null hypothesis at the chosen threshold — not that the groups are equivalent. The correct response is to report the effect size and confidence interval so the reader can judge the practical magnitude of any difference.
Report p < .001. Never write p = .000 — it implies a probability of exactly zero, which is impossible.
A CI for the mean difference expresses precision in the original units of measurement (e.g., kg, mL/kg/min). A CI for Cohen’s d expresses precision in standardized units and allows comparison across studies with different measurement scales. Both are informative; journals increasingly require both.
“Post-test muscular strength was significantly higher in the training group than the control group, \(F(1, 56) = 9.82\), \(p = .003\), partial \(\eta^2 = .149\), 95% CI [.02, .30].”
[1] (Chapter 7) is the definitive source for APA statistical reporting style.[2] provides the original task force recommendations that underpin current standards.[7] makes the case for reporting effect sizes and confidence intervals as the primary evidence in every analysis.[3] and[4] clarify what p-values do and do not tell us. Ready-to-use APA reporting templates for every test in this book are in the APA Style Results Reporting appendix.
Chapter 23 closes the textbook by addressing research credibility — what can go wrong when researchers misuse statistical tools, and what practices protect the integrity of published movement science.
1. American Psychological Association. (2020). Publication manual of the american psychological association (7th ed.). American Psychological Association.
2. Wilkinson, L., & Task Force on Statistical Inference. (1999). Statistical methods in psychology journals: Guidelines and explanations.
American Psychologist,
54(8), 594–604.
https://doi.org/10.1037/0003-066X.54.8.594
3. Wasserstein, R. L., & Lazar, N. A. (2016). The ASA statement on p-values: Context, process, and purpose.
The American Statistician,
70(2), 129–133.
https://doi.org/10.1080/00031305.2016.1154108
4. Wasserstein, R. L., Schirm, A. L., & Lazar, N. A. (2019). Moving to a world beyond "p < 0.05".
The American Statistician,
73(sup1), 1–19.
https://doi.org/10.1080/00031305.2019.1583913
5. Greenland, S., Senn, S. J., Rothman, K. J., Carlin, J. B., Poole, C., Goodman, S. N., & Altman, D. G. (2016). Statistical tests, p values, confidence intervals, and power: A guide to misinterpretations.
European Journal of Epidemiology,
31, 337–350.
https://doi.org/10.1007/s10654-016-0149-3
6. Cohen, J. (1994). The earth is round (p < .05).
American Psychologist,
49(12), 997–1003.
https://doi.org/10.1037/0003-066X.49.12.997
7. Cumming, G. (2014). The new statistics: Why and how.
Psychological Science,
25(1), 7–29.
https://doi.org/10.1177/0956797613504966
8. Hoenig, J. M., & Heisey, D. M. (2001). ABCs of alpha, beta, delta, and epsilon.
Ecology,
82(12), 3369–3372.
https://doi.org/10.1890/0012-9658(2001)082[3369:AOABDE]2.0.CO;2