
x <- c(2,4,5,8,10,11,14,16,3,4,5)Learning Objectives
- Understand what percentiles are and how they are used to measure and compare the distribution of a data set.
- Know how to calculate the percentile rank of a given value within a data set.
- Understand how to use percentiles to compare values within a data set and to compare data sets.
- Know how to use percentiles to communicate the distribution of a data set in a clear and concise way.
- Understand how to use percentiles to make informed decisions based on data.
- Be able to interpret and analyze percentile data in the context of real-world situations.
Introduction to percentiles
Definition of percentiles
A percentile is a measure used in statistics that indicates the value below which a certain percentage of observations in a group fall. For example, the 20th percentile is the value below which 20% of the observations may be found. Percentiles can be used to compare the relative standing of a value within a dataset. For example, if a student’s test score is in the 90th percentile, it means that the student scored higher than 90% of the other students who took the test.
Percentiles can also be used to determine the distribution of values within a dataset. For example, if the majority of scores fall within the lower percentiles, it may indicate that the scores are generally lower, while if the majority of scores fall within the higher percentiles, it may indicate that the scores are generally higher.
Percentiles can be calculated using a variety of methods, but one common method is to first arrange the data in order from smallest to largest and then identify the value that corresponds to the desired percentile.
How to calculate percentiles
A percentile is a measure used in statistics that indicates the value below which a certain percentage of observations in a group fall.
To calculate the percentile by hand, you will need to follow these steps:
- Arrange the data set in numerical order.
- Determine the position of the percentile you want to calculate in the data set. For example, the 50th percentile is also known as the median.
- Calculate the percentile by multiplying the position of the percentile by the total number of values in the data set and then dividing that number by 100. For example, if you want to calculate the 50th percentile of a data set with 10 values, you would multiply 5 (the position of the 50th percentile) by 10 (the total number of values) and then divide by 100, like this: (5 * 10) / 100 = 0.5.
- To find the value at the percentile you calculated, go to the position in the data set that corresponds to the percentile value. For example, if the percentile you calculated was 0.5, you would go to the 5th value in the data set (since the data set has 10 values and 0.5 is the halfway point).
Here are a few examples to illustrate this process:
Example 1:
Suppose you have the following data set: {1, 2, 3, 4, 5, 6, 7, 8, 9, 10}.
To find the 50th percentile (also known as the median), you would follow these steps:
- Arrange the data set in numerical order: {1, 2, 3, 4, 5, 6, 7, 8, 9, 10}
- Determine the position of the 50th percentile: 50th percentile = (50 / 100) * 10 = 5
- Go to the position in the data set that corresponds to the percentile value: 5th value in the data set = 5
So the 50th percentile (median) of this data set is 5.
Example 2:
Suppose you have the following data set: {5, 7, 8, 12, 14, 15, 16, 17, 18, 20}.
To find the 75th percentile, you would follow these steps:
- Arrange the data set in numerical order: {5, 7, 8, 12, 14, 15, 16, 17, 18, 20}
- Determine the position of the 75th percentile: 75th percentile = (75 / 100) * 10 = 7.5
- Go to the position in the data set that corresponds to the percentile value: 7.5 is between the 7th and 8th values in the data set, so you would take the average of these two values to get the 75th percentile: (16 + 17) / 2 = 16.5
So the 75th percentile of this data set is 16.5.
Percentiles can be used to compare the relative standing of a value within a dataset.
Uses of percentiles
Understanding the distribution of data
Percentile can be used to understand the distribution of data. It indicates the value below which a certain percentage of data falls. For example, if the 50th percentile of a dataset is 50, it means that 50% of the data falls below that value.
To understand the distribution of data using percentile, we can calculate the percentiles for different values in the dataset. For example, if we have a dataset of 100 values, we can calculate the 10th percentile, 25th percentile, 50th percentile (also known as the median), 75th percentile, and 90th percentile. These values will give us an idea of how the data is distributed.
For example, if the 10th percentile is 20 and the 90th percentile is 80, it means that 10% of the data falls below 20 and 90% of the data falls below 80. This indicates that the data is distributed relatively evenly, with a few outliers on either side. On the other hand, if the 10th percentile is 20 and the 90th percentile is 90, it means that there is a larger concentration of data towards the higher end of the scale.
Using percentile can help us understand the distribution of data and identify patterns or trends in the data. It can also be used to compare different datasets and see how they differ in terms of distribution.
Comparing data sets
Using percentiles can be a useful way to compare data sets because it allows you to see how a particular value in one dataset compares to values in another dataset. For example, if you have two datasets with different numbers of values, you can use percentiles to see how a particular value in one dataset compares to values in the other dataset. This can be especially useful when the datasets have different scales or units of measurement.
For example:
To calculate the percentile of a particular value in a dataset, you can use the following formula:
Percentile = (Number of values below the given value / Total number of values) x 100
For example, let’s say you have a dataset with the following values: 3, 5, 7, 8, 9, 10
To find the percentile of the value 7, you would count the number of values below 7, which is 2 (3 and 5). The total number of values in the dataset is 6. Plugging these values into the formula gives us:
Percentile = (2 / 6) x 100 = 33.33
This means that the value 7 is at the 33.33rd percentile in the dataset.
Percentile rank
Definition of percentile rank
Percentile rank is a measure of the relative standing of a value in a dataset. It indicates the percentage of values in the dataset that are equal to or less than the value in question. For example, if a value has a percentile rank of 75, it means that 75% of the values in the dataset are equal to or less than that value.
Percentile ranks are commonly used to describe how well a person has performed on a test or assessment relative to a group of people. For example, if a person scores in the 75th percentile on a test, it means that they scored higher than 75% of the people who took the test. Percentile ranks can also be used to compare the scores of different groups of people, such as comparing the scores of students in different schools or at different grade levels.
It’s important to note that percentile rank is different from percentage. Percentile rank describes the relative standing of a value within a dataset, while percentage is a measure of the number of items in a set relative to the total number of items.
How to calculate percentile rank
Percentile rank is a way to determine the relative position of a score within a distribution of scores. It can be calculated by the following steps:
Organize the scores in the distribution in ascending order, with the lowest score at the bottom.
Determine the position of the score in question within this ordered distribution. For example, if there are 100 scores in the distribution and the score in question is the 50th, it is at the 50th percentile.
Calculate the percentile rank as a percentage by dividing the position of the score in the distribution by the total number of scores and multiplying by 100. For example, if the score in question is the 50th out of 100 scores, its percentile rank would be 50/100 * 100 = 50%.
Example of finding the percentile rank for a given score
Percentile rank is a measure of the relative standing of a value in a dataset.
It’s also possible to use a percentile rank calculator to determine the percentile rank for a given score and distribution of scores. These calculators can be found online or in statistical software.
Here’s an example of how to calculate percentile rank:
Suppose you have a distribution of scores for a group of students on a test, and you want to determine the percentile rank of a score of 80. The scores in the distribution are as follows:
70, 72, 73, 75, 76, 78, 78, 79, 80, 81, 82, 82, 84, 85, 85, 87, 88, 88, 89, 90
To find the percentile rank of a score of 80, you would first put the scores in ascending order:
70, 72, 73, 75, 76, 78, 78, 79, 80, 81, 82, 82, 84, 85, 85, 87, 88, 88, 89, 90
Then you would determine the position of the score of 80 in the distribution: it is the 10th score out of 20 scores.
Finally, you would calculate the percentile rank as a percentage by dividing the position of the score in the distribution by the total number of scores and multiplying by 100:
Percentile rank = 10/20 * 100 = 50%
This means that a score of 80 is at the 50th percentile, which means that it is higher than 50% of the scores in the distribution.
Percentiles in statistics software
Calculating percentiles in jamovi
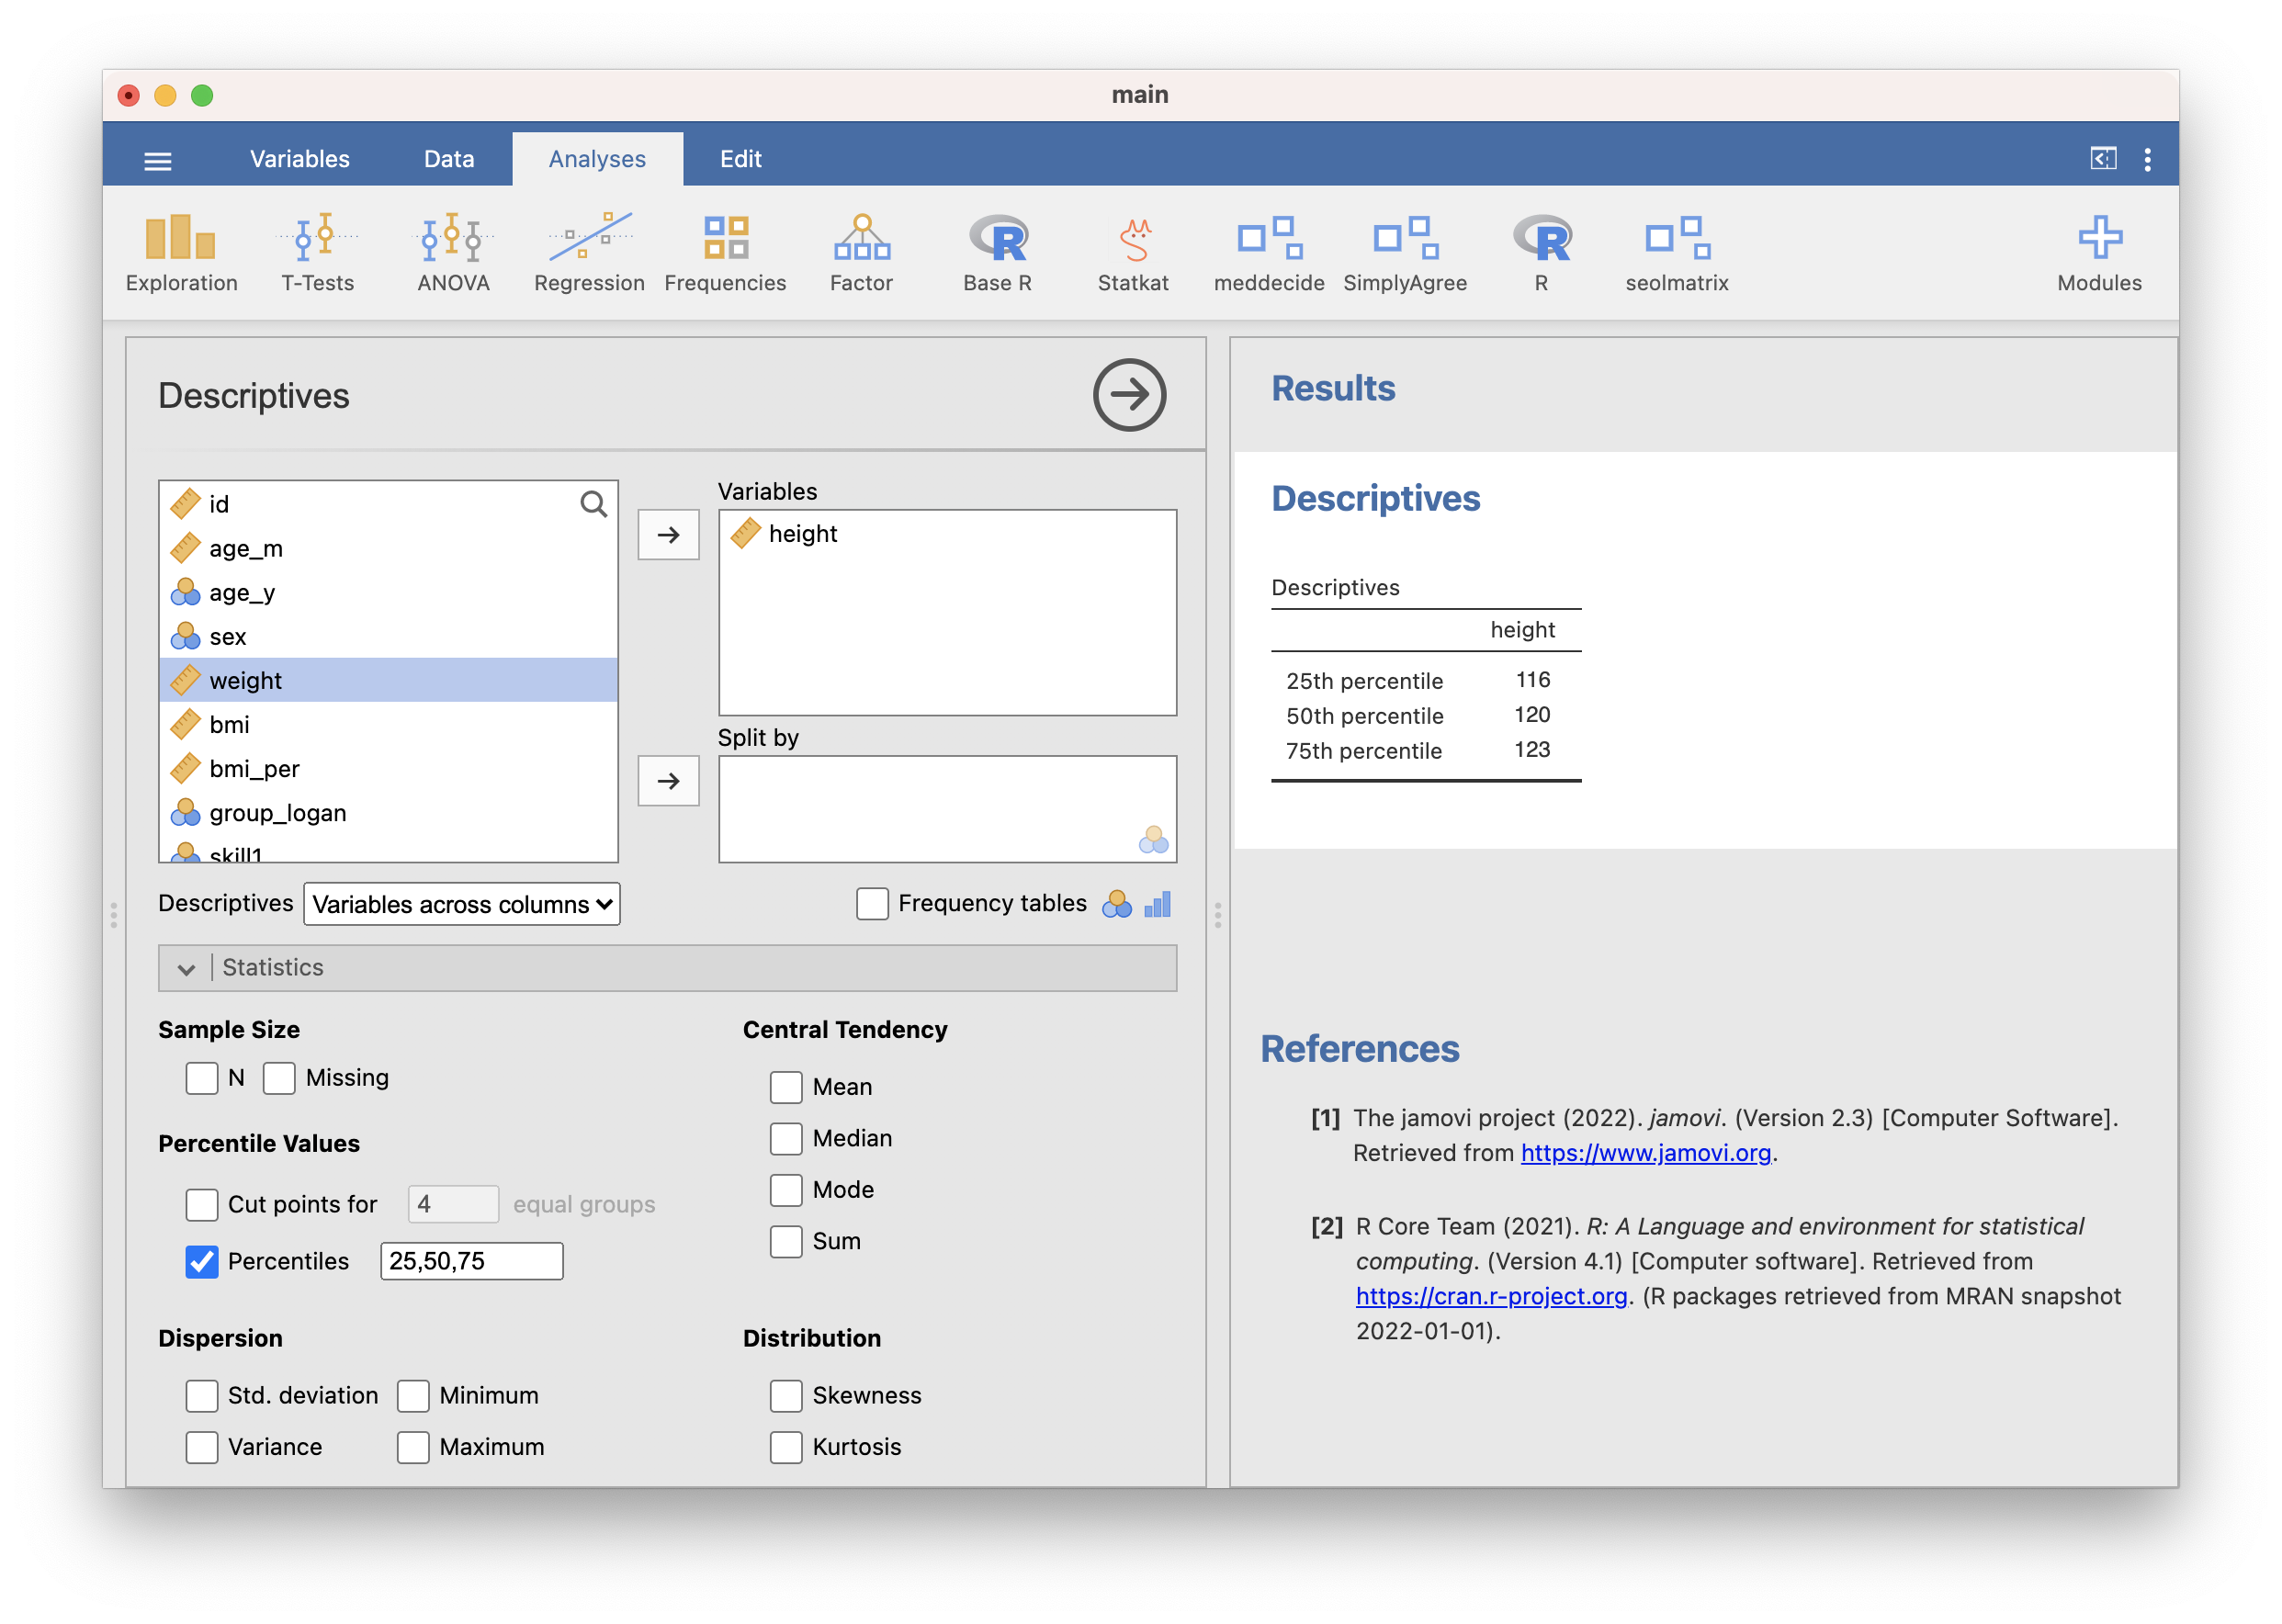
To calculate percentiles in jamovi, you can use the “Quantiles” module in the “Descriptives” module.
Here’s how you can use it:
- Open the “Descriptives” module in jamovi.
- Select the “Quantiles” tab.
- In the “Variable” field, select the variable for which you want to calculate percentiles.
- In the “Quantiles” field, specify the percentiles you want to calculate. You can enter multiple percentiles separated by commas, or you can use the “All” option to calculate all percentiles from 0 to 100.
- Click the “Run” button to calculate the percentiles.
The results will be displayed in a table, with one row for each percentile that you specified. The table will include the percentile value, as well as the count and percentage of observations that are below that percentile.
You can also use the “Graph” tab in the “Descriptives” module to create a box plot or a histogram of the data, which can help you visualize the distribution of the data and identify any outliers.
Calculating percentiles in Excel
To calculate percentiles in Excel, you can use the PERCENTILE function. The PERCENTILE function takes two arguments: an array of data and the percentile value that you want to calculate.
For example, suppose you have a range of data in cells A1:A10 and you want to calculate the 25th percentile. You can use the following formula:
=PERCENTILE(A1:A10, 0.25)
This will return the value at the 25th percentile of the data in the range A1:A10.
You can also use the PERCENTILE.INC function to calculate percentiles, which is similar to the PERCENTILE function but calculates the percentile using inclusive interpolation. For example:
=PERCENTILE.INC(A1:A10, 0.25)
This will also return the value at the 25th percentile of the data in the range A1:A10, but using inclusive interpolation.
You can use the PERCENTILE and PERCENTILE.INC functions to calculate other percentiles as well. Simply replace the percentile value in the formula with the desired percentile. For example, to calculate the 50th percentile (also known as the median), you can use:
=PERCENTILE(A1:A10, 0.50)
or
=PERCENTILE.INC(A1:A10, 0.50)
Calculating percentiles in SPSS
To calculate percentiles in SPSS, you can use the “Percentile” function. Here’s how:
- Select “Transform” from the menu at the top of the SPSS window.
- Click “Rank Cases” from the dropdown menu.
- In the “Rank Cases” dialog box, select the variable that you want to calculate percentiles for from the “Numeric Expression” box.
- In the “Output Variable” box, enter a name for the new variable that will contain the percentile ranks.
- Click “OK” to compute the percentile ranks.
Once the percentile ranks have been calculated, you can use the “Frequency” function to see the percentiles. To do this:
- Select “Analyze” from the menu at the top of the SPSS window.
- Click “Descriptive Statistics” and then “Frequencies” from the dropdown menu.
- In the “Variable(s)” box, select the variable that contains the percentile ranks.
- Click “Statistics” and then check the “Percentiles” box.
- Click “OK” to see the percentiles in the output window.
Alternatively, you can use the “Explore” function to see the percentiles. To do this:
- Select “Analyze” from the menu at the top of the SPSS window.
- Click “Descriptive Statistics” and then “Explore” from the dropdown menu.
- In the “Dependent List” box, select the variable that you want to calculate percentiles for.
- In the “Statistics” box, check the “Percentiles” box.
- Click “OK” to see the percentiles in the output window.
Calculating percentiles in R
To calculate percentiles in R, you can use the quantile() function. This function takes a numeric vector as its first argument and a probability (or quantile) as its second argument. It returns the value at the specified quantile of the input vector.
First, we will create a vector x with \(n\) = 11.
For example, to calculate the 50th percentile (i.e., the median) of a vector x, you can use the following code:
quantile(x, 0.5)50%
5 To calculate other percentiles, you can specify the desired percentile as a decimal between 0 and 1. For example, to calculate the 75th percentile, you can use the following code:
quantile(x, 0.75) 75%
10.5 You can also calculate multiple percentiles at once by passing a vector of probabilities to the quantile() function. For example, to calculate the 25th, 50th, and 75th percentiles, you can use the following code:
quantile(x, c(0.25, 0.5, 0.75)) 25% 50% 75%
4.0 5.0 10.5 Conclusion
Recap of key points
- Percentiles are a way to rank data in a dataset.
- The nth percentile is the value below which n% of the data falls.
- Percentiles can be calculated using a formula that involves the size of the dataset, the rank of the value, and the value itself.
- Percentiles are useful for comparing values within a dataset and understanding how they relate to one another.
- Percentiles can be used to identify trends and patterns in data, such as identifying outliers or identifying where most of the data lies.
- Percentiles can be represented visually using a box plot or other graphical representation.
- Percentiles can be used in many different fields, including statistics, finance, and healthcare.
Applications of percentiles in real-world situations
- Determining athletic performance levels: Percentiles can be used to compare an athlete’s performance to their peers or to a larger group. For example, a coach may use percentiles to determine if an athlete’s vertical jump score is in the top 10% or 25% of their age group or sport.
- Assessing health and fitness levels: Percentiles can be used to determine if an individual’s body mass index (BMI), blood pressure, or other health markers are within a healthy range. For example, a healthcare provider may use percentiles to determine if a patient’s BMI is in the normal range (between the 5th and 85th percentile) or if they are at risk for obesity (above the 85th percentile).
- Evaluating physical therapy progress: Physical therapists may use percentiles to track an individual’s progress over time. For example, if a patient’s balance scores are in the 30th percentile at the start of physical therapy and improve to the 75th percentile after several weeks of treatment, this can be considered a significant improvement.
- Analyzing research results: Researchers may use percentiles to compare the results of their study to a larger population. For example, if a study found that the average running time for a group of athletes was in the 75th percentile compared to a larger population, this could suggest that the athletes were performing at a high level.
- Setting goals and targets: Percentiles can be used to set goals and targets for athletes or individuals looking to improve their health and fitness levels. For example, if a person’s BMI is in the 50th percentile, they may set a goal to improve to the 75th percentile to be considered in the “healthy” range.
Further resources for learning about percentiles
Image credit
Illustration by Elisabet Guba from Ouch!
Reuse
Citation
BibTeX citation:
@misc{furtado2022,
  author = {Furtado, Ovande},
  title = {Percentiles},
  date = {2022-12-30},
  url = {https://drfurtado.github.io/randomstats/posts/percentiles/},
  langid = {en}
}
For attribution, please cite this work as:
Furtado, Ovande. 2022. “Percentiles.” RandomStats
(blog). December 30, 2022. https://drfurtado.github.io/randomstats/posts/percentiles/.