Lab 2
Measures of Central Tendency and Measures of Variability Assignment
Objective
Objective: To assess students’ understanding of measures of central tendency and measures of variability and their ability to use jamovi for data analysis.
Instructions
- Open Jamovi and create a new data set with the following variables: Gender and Reaction Time (ms).
- Enter the provided data set into the Jamovi data spreasheet.
- Click on “Descriptives” under the “Exploration” tab in the top menu.
- Select the “Reaction Time (ms)” variable and drag it into the “Variables” box.
- Select the “Gender” variable and drag it into the “Split by” box.
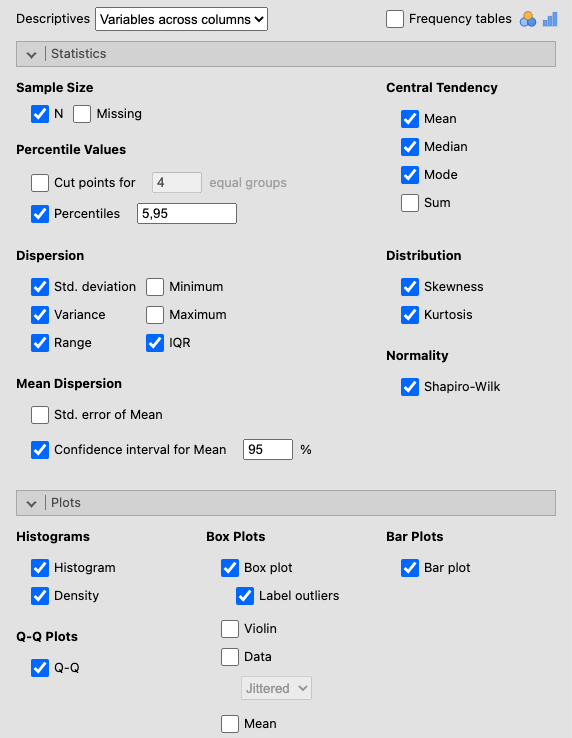
- Under “Statistics” and “Plots”, select all checked items depicted in Figure 1.
- Review the generated table and graphs to ensure that the output is accurate and complete.
- Export the output as PDF and choose the desired destination to save the PDF file.
- Name the file with your first initial and last name and submit the file via Canvas (Lab 2 - Part 1).
- Complete Part 2 on Canvas - 2-question quiz
Remember that this assignment must be completed individually, and that plagiarism is prohibited. Review the plagiarism policy posted on the CSUN website before submitting your assignment. Note: The generated PDF file should contain the Descriptives Table (variables across columns) and the relevant graphs. Be sure to review the file before submitting it to ensure it contains all the required information.
Grading rubric
Total points available: 90
| Component | Points |
|---|---|
File submission (Part 1) containing the following:
|
50 |
| 20-question quiz | 40 |
Data
Copy the data below and paste it to jamovi, or download it as .csv.
| Gender | Reaction Time (ms) |
|---|---|
| Male | 215 |
| Male | 203 |
| Male | 197 |
| Male | 208 |
| Male | 222 |
| Male | 212 |
| Male | 194 |
| Male | 219 |
| Male | 201 |
| Male | 214 |
| Female | 185 |
| Female | 172 |
| Female | 190 |
| Female | 165 |
| Female | 150 |
| Female | 180 |
| Female | 195 |
| Female | 170 |
| Female | 210 |
| Female | 148 |