Motivation
This post1 shows two different ways to format descriptive tables in jamovi.
Understanding the problem
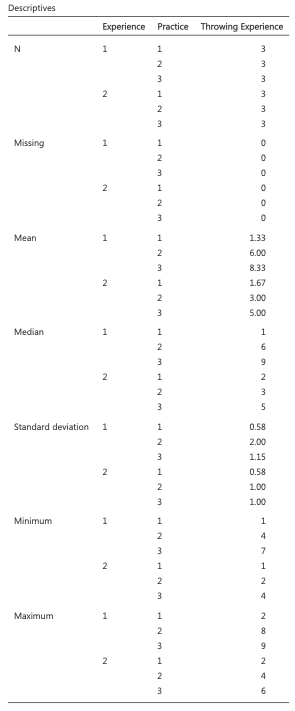
When creating descriptive tables in jamovi2 , you can either select to display variables across columns or across rows. Depending on your choice, tables may not fit your needs.
Below are two examples of descriptive tables generated in jamovi. Figure 1 shows a table with variables across columns and Figure 2 shows a table with variables across rows.
Learn how to choose either format by watching the video at the end of this post.
Tip
Instead of copying a table from the output, you can export the table as PDF. Some journal articles require authors to save tables as PDF and submit them as separate files.


The solution
Footnotes
- Illustration by Oleg Shcherba from Ouch! ↩︎
Citation
BibTeX citation:
@online{furtado_jr2022,
  author = {Furtado Jr, Ovande},
  title = {“{Fixing}” Long Tables in Jamovi},
  date = {2022-05-16},
  langid = {en}
}
For attribution, please cite this work as:
Furtado Jr, Ovande. 2022. “‘Fixing’ Long Tables in
Jamovi.” May 16, 2022.